Weekly Housing Trends View—Data for Week Ending June 29, 2024
Our research team releases monthly housing trends reports. These regular reports break down inventory metrics like the number of active listings and the pace of the market. In addition, we continue to give readers more timely weekly updates, an effort that began in response to the rapid changes in the economy and housing as a result of the COVID-19 pandemic. Generally, you can look forward to a Weekly Housing Trends View, the latest weekly housing data on Thursdays, and monthly video updates from our economists. Here’s what the housing market looked like over the past week.
What this week’s data means
Mortgage rates have trended lower over the past two months, and fell for the fourth consecutive week last week. Rates have eased nearly four-tenths of a percentage point since early May, and this week’s data shows that the housing market might be starting to respond.
Price growth and new listing growth both picked up compared with the previous week, suggesting an uptick in both buyer and seller activity. More fresh listings is great news for buyers, but higher price growth might be a bit discouraging.
Nevertheless, the share of homes seeing a price reduction continues to climb year over year, suggesting sellers are continuing to adjust their expectations.
Key findings
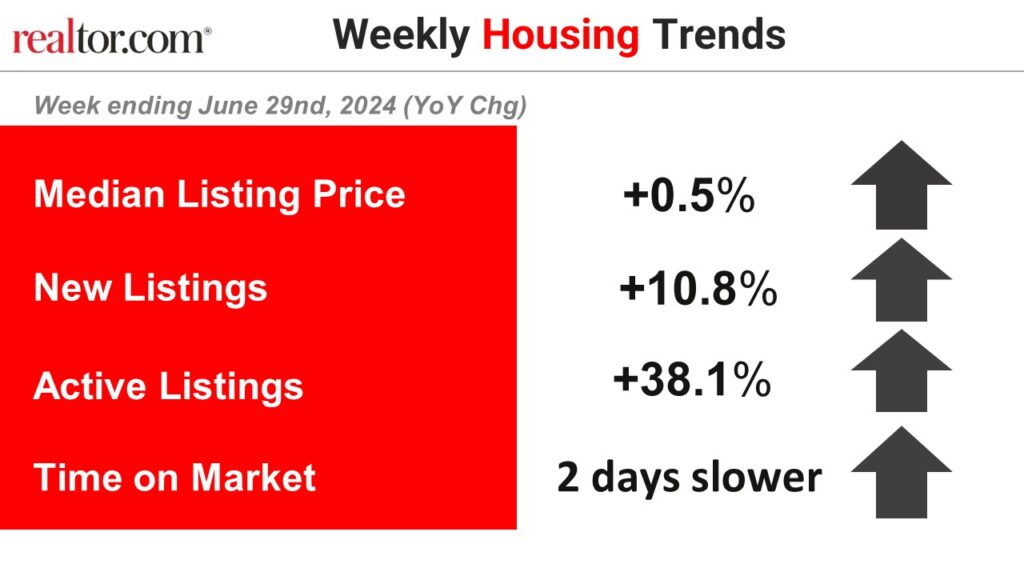
- The median listing price grew 0.5% year over year
Home prices grew 0.5% year over year after four weeks of flat price growth. Months of growing affordable inventory has kept home price growth low, despite still-climbing prices on a per-square-foot basis. More small, affordable inventory is helpful for many buyers, especially first-time buyers. However, in general, similar-sized homes are more expensive than they were a year ago.
- New listings–a measure of sellers putting homes up for sale–were up this week, by 10.8% from one year ago
Seller activity picked up momentum this week. New listing activity increased annually, climbing by more than in any week back to late April. Recently falling mortgage rates might be encouraging more homeowners to list their homes for sale.
Today’s prevailing mortgage rate is still well above the average outstanding mortgage rate. As rates move closer to the typical mortgage-holder’s rate, more sellers are likely to enter the market. However, nearly 90% of mortgages have a rate below 6%, so it will likely take some time for sellers to enter the market en masse.
- Active inventory increased, with for-sale homes 38.1% above year-ago levels
For the 34th week in a row, the number of for-sale homes grew compared with one year ago. This past week, the inventory of homes for sale grew by 38.1% compared with last year, increasing the gap compared with recent weeks and notching the largest annual increase since April 2023.
Despite nearly eight months of building inventory, buyers still see more than 30% fewer homes for sale compared with before the pandemic. Limited home supply has kept upward pressure on home prices, which, combined with still-high mortgage rates, means many buyers remain on the sidelines.
- Homes spent two days more on the market compared with this time last year
The typical home for sale spent two more days on the market this past week compared with last year, continuing the trend observed in recent weeks. Longer time on the market means selling may require more patience while buyers may have more time to make a decision, a buyer-friendly trend.
Data summary
| All changes year over year | Year-to-date 2024 | Week ending June 15, 2024 | Week ending June 22, 2024 | Week ending June 29, 2024 |
| Median listing prices | 0.2% | 0.0% | 0.0% | 0.5% |
| New listings | 9.2% | 8.0% | 7.4% | 10.8% |
| Active listings | 25.2% | 36.0% | 36.1% | 38.1% |
| Time on market | 1 day faster | 2 days slower | 2 days slower | 2 days slower |
© 1995-2024 National Association of REALTORS® and Move, Inc. All rights reserved.
Categories
Recent Posts